Plot using Deepnote notebook
Use the code below to generate the above plot with Deepnote notebook.
_dntk.DeepnoteChart(bl_funding, spec_dict={
"layer": [
{
"layer": [
{
"layer": [
{
"mark": {
"clip": True,
"type": "circle",
"color": "#CC8BFF",
"tooltip": True
},
"encoding": {
"x": {
"axis": {
"grid": False,
"title": None,
"format": ".0f"
},
"sort": None,
"type": "quantitative",
"field": "year",
"scale": {
"type": "linear",
"zero": False
},
"format": {
"type": "number",
"decimals": 0
},
"formatType": "numberFormatFromNumberType"
},
"y": {
"axis": {
"grid": False,
"title": "GBP (millions)",
"format": {
"type": "default",
"decimals": None
},
"formatType": "numberFormatFromNumberType"
},
"type": "quantitative",
"field": "gia_y2000_gbp_millions",
"scale": {
"type": "linear",
"zero": False
},
"format": {
"type": "default",
"decimals": None
},
"formatType": "numberFormatFromNumberType"
},
"color": {
"type": "nominal",
"datum": "UK government (adjusted)",
"scale": {
"range": [
"#CC8BFF"
],
"domain": [
"UK government (adjusted)"
]
}
}
},
"transform": []
}
]
},
{
"layer": [
{
"mark": {
"clip": True,
"type": "circle",
"color": "#8018D3",
"tooltip": True
},
"encoding": {
"x": {
"axis": {
"grid": False,
"title": None,
"format": ".0f"
},
"sort": None,
"type": "quantitative",
"field": "year",
"scale": {
"type": "linear",
"zero": False
},
"format": {
"type": "number",
"decimals": 0
},
"formatType": "numberFormatFromNumberType"
},
"y": {
"axis": {
"grid": False,
"title": "GBP (millions)",
"format": {
"type": "default",
"decimals": None
},
"formatType": "numberFormatFromNumberType"
},
"type": "quantitative",
"field": "total_y2000_gbp_millions",
"scale": {
"type": "linear",
"zero": False
},
"format": {
"type": "default",
"decimals": None
},
"formatType": "numberFormatFromNumberType"
},
"color": {
"type": "nominal",
"datum": "Total funding (adjusted)",
"scale": {
"range": [
"#8018D3"
],
"domain": [
"Total funding (adjusted)"
]
}
}
},
"transform": []
}
]
},
{
"layer": [
{
"mark": {
"clip": True,
"type": "line",
"color": "#2266D3",
"tooltip": True
},
"encoding": {
"x": {
"axis": {
"grid": False,
"title": None,
"format": ".0f"
},
"sort": None,
"type": "quantitative",
"field": "year",
"scale": {
"type": "linear",
"zero": False
},
"format": {
"type": "number",
"decimals": 0
},
"formatType": "numberFormatFromNumberType"
},
"y": {
"axis": {
"grid": False,
"title": "GBP (millions)",
"format": {
"type": "default",
"decimals": None
},
"formatType": "numberFormatFromNumberType"
},
"type": "quantitative",
"field": "nominal_gbp_millions",
"scale": {
"type": "linear",
"zero": False
},
"format": {
"type": "default",
"decimals": None
},
"formatType": "numberFormatFromNumberType"
},
"color": {
"type": "nominal",
"datum": "Total funding",
"scale": {
"range": [
"#2266D3"
],
"domain": [
"Total funding"
]
}
}
},
"transform": []
}
]
},
{
"layer": [
{
"mark": {
"clip": True,
"type": "line",
"color": "#83AFF6",
"tooltip": True
},
"encoding": {
"x": {
"axis": {
"grid": False,
"title": None,
"format": ".0f"
},
"sort": None,
"type": "quantitative",
"field": "year",
"scale": {
"type": "linear",
"zero": False
},
"format": {
"type": "number",
"decimals": 0
},
"formatType": "numberFormatFromNumberType"
},
"y": {
"axis": {
"grid": False,
"title": "GBP (millions)",
"format": {
"type": "default",
"decimals": None
},
"formatType": "numberFormatFromNumberType"
},
"type": "quantitative",
"field": "gia_gbp_millions",
"scale": {
"type": "linear",
"zero": False
},
"format": {
"type": "default",
"decimals": None
},
"formatType": "numberFormatFromNumberType"
},
"color": {
"type": "nominal",
"datum": "UK government",
"scale": {
"range": [
"#83AFF6"
],
"domain": [
"UK government"
]
}
}
},
"transform": []
}
]
}
],
"resolve": {
"scale": {
"color": "independent"
}
}
}
],
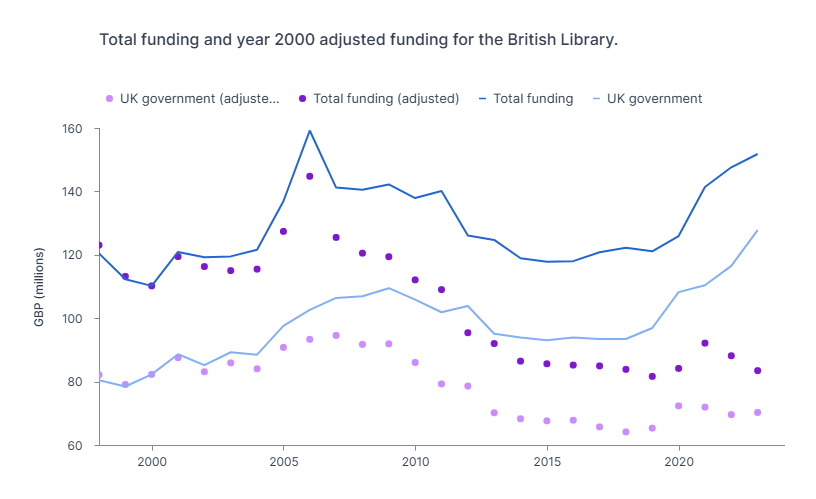
"title": "Total funding and year 2000 adjusted funding for the British Library.",
"config": {
"legend": {
"orient": "top",
"disable": False
}
},
"$schema": "https://vega.github.io/schema/vega-lite/v5.json",
"encoding": {}
})