import pandas as pd
import numpy as np
import matplotlib.pyplot as plt
from matplotlib.lines import Line2D
import seaborn as snsTidyTuesday dataset of September 30, 2025
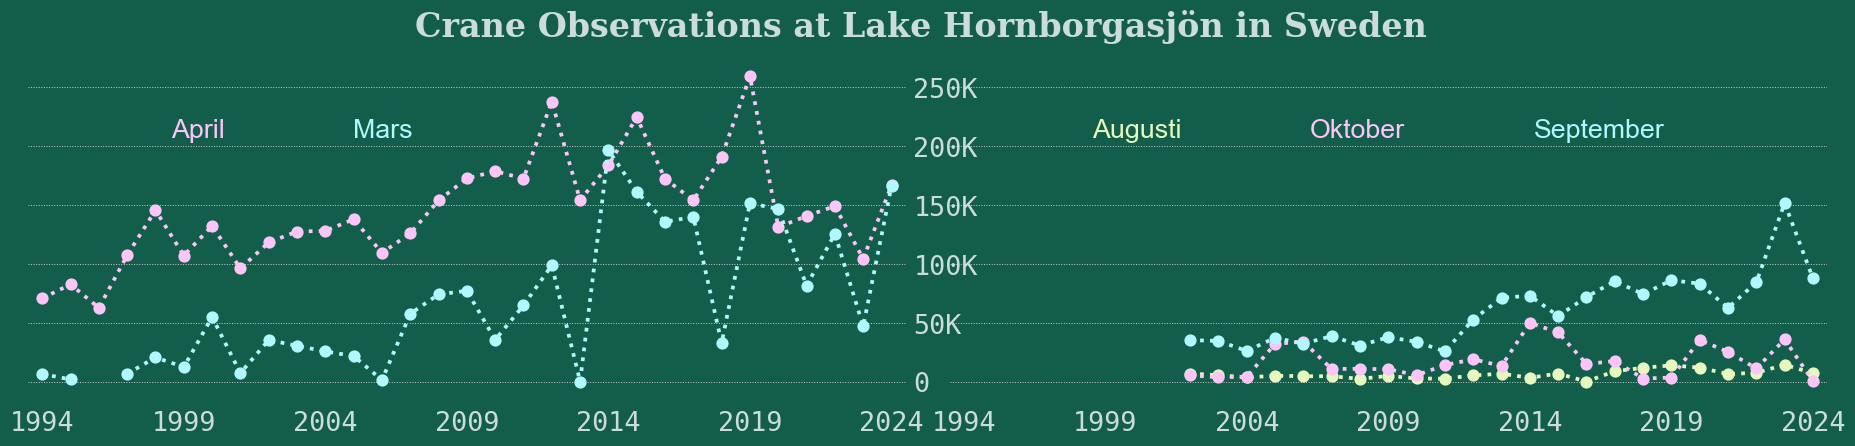
cranes = pd.read_csv('https://raw.githubusercontent.com/rfordatascience/tidytuesday/main/data/2025/2025-09-30/cranes.csv')cranes| date | observations | comment | weather_disruption | |
|---|---|---|---|---|
| 0 | 2024-10-03 | 408.0 | Last count of season | False |
| 1 | 2024-09-30 | 14940.0 | NaN | False |
| 2 | 2024-09-26 | NaN | Canceled/No count | True |
| 3 | 2024-09-23 | 18450.0 | NaN | False |
| 4 | 2024-09-19 | 14900.0 | NaN | False |
| ... | ... | ... | ... | ... |
| 1543 | 1994-03-28 | NaN | Canceled/No count | False |
| 1544 | 1994-03-27 | NaN | Canceled/No count | False |
| 1545 | 1994-03-26 | NaN | Canceled/No count | False |
| 1546 | 1994-03-25 | 200.0 | NaN | False |
| 1547 | 1994-03-24 | 200.0 | NaN | False |
1548 rows × 4 columns
cranes['date'] = pd.to_datetime(cranes['date'])
# add month and year columns. Month should be three letter

cranes['year'] = cranes['date'].dt.year
cranes['month'] = cranes['date'].dt.month

cranes['month'] = cranes['date'].dt.strftime('%b')
cranes['year_half'] = cranes['month'].apply(lambda x: 'first_half' if x in ['Jan', 'Feb', 'Mar', 'Apr', 'May', 'Jun'] else 'second_half')cranes| date | observations | comment | weather_disruption | year | month | year_half | |
|---|---|---|---|---|---|---|---|
| 0 | 2024-10-03 | 408.0 | Last count of season | False | 2024 | Oct | second_half |
| 1 | 2024-09-30 | 14940.0 | NaN | False | 2024 | Sep | second_half |
| 2 | 2024-09-26 | NaN | Canceled/No count | True | 2024 | Sep | second_half |
| 3 | 2024-09-23 | 18450.0 | NaN | False | 2024 | Sep | second_half |
| 4 | 2024-09-19 | 14900.0 | NaN | False | 2024 | Sep | second_half |
| ... | ... | ... | ... | ... | ... | ... | ... |
| 1543 | 1994-03-28 | NaN | Canceled/No count | False | 1994 | Mar | first_half |
| 1544 | 1994-03-27 | NaN | Canceled/No count | False | 1994 | Mar | first_half |
| 1545 | 1994-03-26 | NaN | Canceled/No count | False | 1994 | Mar | first_half |
| 1546 | 1994-03-25 | 200.0 | NaN | False | 1994 | Mar | first_half |
| 1547 | 1994-03-24 | 200.0 | NaN | False | 1994 | Mar | first_half |
1548 rows × 7 columns
df_obs = cranes.groupby(['year','year_half', 'month'])['observations'].sum().reset_index()month_mapping = {'Mar':'Mars', 'Apr':'April', 'Aug':'Augusti', 'Sep':'September', 'Oct':'Oktober'}
bg_color = '#135E4B'
fg_color = '#CCDCDB'
custom_map = ['#FCC5F8','#B3F7FE','#E7F8BE']
sns.set_theme(font_scale=1.75)
sns.set_style('white')
g = sns.catplot(data=df_obs, x='year', y='observations', col='year_half', kind='point', hue='month', \
aspect=2, alpha=1, legend=True, linestyles=':', height=5, palette=custom_map)
g.set_titles(template="")
legend_labels = list(g._legend_data.keys())
# remove legend
g._legend.remove()
# set x-tick at interval of 10
for ax in g.axes.flat:
ax.set_xticks(range(0,32,5))
ax.set_xlabel("")
ax.set_ylabel("")
ax.yaxis.grid(True,linestyle=':', linewidth=0.7,)
# ax.xaxis.grid(True,linestyle=':', linewidth=0.3,)
ax.spines[['left','bottom']].set_visible(False)
yticks = [f'{int(x/1000)}K' if x > 0 else 0 for x in ax.get_yticks()]
ax.set_yticklabels(yticks, fontfamily='monospace')
ax.set_xticklabels(ax.get_xticklabels(), fontfamily='monospace')
ax.set_facecolor(bg_color)
ax.tick_params(colors=fg_color)
# Create separate legends for each subplot
for ind, ax in enumerate(g.axes.flat):
# Get all lines in the subplot
lines = ax.lines
# Filter lines that have actual data (non-NaN y-values)
valid_lines = []
for line in lines:
# Skip error bars (unlabeled lines)
if line.get_label() == '':
continue
# Check if line has non-NaN data
ydata = line.get_ydata()
if not np.all(np.isnan(ydata)):
valid_lines.append(line)
# Extract labels from valid lines
labels = [line.get_label() for line in valid_lines]
# Sort labels numerically (if possible) or alphabetically
try:
# Try to convert labels to integers for numerical sorting
sorted_indices = sorted(range(len(labels)), key=lambda i: int(labels[i]))
except ValueError:
# Fall back to alphabetical sorting if labels aren't numbers
sorted_indices = sorted(range(len(labels)), key=lambda i: labels[i])
# Reorder lines and labels
sorted_lines = [valid_lines[i] for i in sorted_indices]
sorted_labels = [labels[i] for i in sorted_indices]
# print(sorted_labels)
dummy_handles = [Line2D([], [], marker='none', linestyle='none')
for _ in sorted_lines]
# Add legend to subplot
if ind==0:
legend = ax.legend(
handles=dummy_handles,
labels=[month_mapping[label] for label in legend_labels[:2]],
title='month',
loc='upper left',
frameon=False,
ncol=3,
bbox_to_anchor=(0.05, 0.9)
)
if ind>0:
legend = ax.legend(
handles=dummy_handles,
labels=[month_mapping[label] for label in legend_labels[2:]],
title='month',
loc='upper left',
frameon=False,
ncol=3,
bbox_to_anchor=(0.05, 0.9)
)
for text, line in zip(legend.get_texts(), sorted_lines):
text.set_color(line.get_color())
# Remove markers from legend handles
legend.set_title('')
g.axes[0][0].tick_params(labelleft=False)
g.axes[0][1].tick_params(labelleft=True)
g.axes[0][1].tick_params(axis='y', labelleft=True, pad=20)
g.axes[0][1].set_yticklabels(yticks, ha='left')
g.fig.subplots_adjust(wspace=0.05)
g.fig.suptitle('Crane Observations at Lake Hornborgasjön in Sweden', fontsize=24, family='Serif', \
weight='bold', color=fg_color)
g.fig.patch.set_facecolor(bg_color)
plt.savefig("cranes_observations.png", dpi=300, bbox_inches='tight', pad_inches=0.1)
plt.show()