import pandas as pd
import numpy as np
import matplotlib.pyplot as plt
import matplotlib.image as mpimg
from matplotlib.offsetbox import OffsetImage, AnnotationBbox
import flagpy as fpTidyTuesday dataset of October 7, 2025
euroleague_basketball = pd.read_csv('https://raw.githubusercontent.com/rfordatascience/tidytuesday/main/data/2025/2025-10-07/euroleague_basketball.csv')euroleague_basketball| Team | Home city | Arena | Capacity | Last season | Country | FinalFour_Appearances | Titles_Won | Years_of_FinalFour_Appearances | Years_of_Titles_Won | |
|---|---|---|---|---|---|---|---|---|---|---|
| 0 | Anadolu Efes | Istanbul | Basketball Development Center | 10,000 | 6th | Turkey | 5 | 2 | 2000, 2001, 2019, 2021, 2022 | 2021, 2022 |
| 1 | Barcelona | Barcelona | Palau Blaugrana | 7,585 | 5th | Spain | 0 | 0 | NaN | NaN |
| 2 | Baskonia | Vitoria-Gasteiz | Buesa Arena | 15,431 | 14th | Spain | 0 | 0 | NaN | NaN |
| 3 | Bayern Munich | Munich | SAP Garden | 11,500 | 9th | Germany | 0 | 0 | NaN | NaN |
| 4 | Crvena zvezda Meridianbet | Belgrade | Belgrade Arena | 18,386 | 10th | Serbia | 0 | 0 | NaN | NaN |
| 5 | Dubai Basketball | Dubai | Coca-Cola Arena | 17,000 | NaN | United Arab Emirates | 0 | 0 | NaN | NaN |
| 6 | Fenerbahce | Istanbul | Ülker Sports and Event Hall | 13,000 | 1st | Turkey | 7 | 2 | 2015, 2016, 2017, 2018, 2019, 2024, 2025 | 2017, 2025 |
| 7 | Hapoel IBI Tel Aviv | Tel Aviv | Arena 8888 Sofia \ Arena Botevgrad \ Menora ... | 12,373 | (EuroCup) | Israel | 0 | 0 | NaN | NaN |
| 8 | LDLC ASVEL | Villeurbanne | LDLC Arena, Astroballe | 12,523, 5,556 | 15th | France | 0 | 0 | NaN | NaN |
| 9 | Maccabi Rapyd Tel Aviv | Tel Aviv | Menora Mivtachim Arena | 10,383 | 16th | Israel | 0 | 0 | NaN | NaN |
| 10 | Monaco | Monaco | Salle Gaston Médecin | 5,000 | 2nd | Monaco | 2 | 0 | 2023, 2025 | NaN |
| 11 | Olimpia Milano | Milan | Unipol Forum | 12,700 | 11th | Italy | 4 | 0 | 1992, 2021 | NaN |
| 12 | Olympiacos | Piraeus | Peace and Friendship Stadium | 12,300 | 3rd | Greece | 14 | 3 | 1994, 1995, 1997, 1999, 2009, 2010, 2012, 2013... | 1997, 2012, 2013 |
| 13 | Panathinaikos | Athens | Telekom Center Athens | 18,300 | 4th | Greece | 13 | 7 | 1994, 1995, 1996, 2000, 2001, 2002, 2005, 2007... | 1996, 2000, 2002, 2007, 2009, 2011, 2024 |
| 14 | Paris Basketball | Paris | Adidas Arena, Accor Arena | 8,000, 15,705 | 8th | France | 0 | 0 | NaN | NaN |
| 15 | Partizan | Belgrade | Belgrade Arena | 18,386 | 12th | Serbia | 3 | 1 | 1988, 1992, 1998, 2010 | 1992 |
| 16 | Real Madrid | Madrid | Movistar Arena | 15,000 | 7th | Spain | 12 | 6 | 1995, 1996, 2011, 2013, 2014, 2015, 2017, 2018... | 1995, 2015, 2018, 2023 |
| 17 | Valencia Basket | Valencia | Roig Arena | 15,600 | (EuroCup) | Spain | 0 | 0 | NaN | NaN |
| 18 | Virtus Olidata Bologna | Bologna | Virtus Arena, PalaDozza | 9,980, 5,570 | 17th | Italy | 0 | 0 | NaN | NaN |
| 19 | Zalgiris | Kaunas | Žalgirio Arena | 15,415 | 13th | Lithuania | 2 | 1 | 1999, 2018 | 1999 |
countries = euroleague_basketball['Country'].unique()
countries
array(['Turkey', 'Spain', 'Germany', 'Serbia', 'United Arab Emirates',
'Israel', 'France', 'Monaco', 'Italy', 'Greece', 'Lithuania'],
dtype=object)# save flag for each country
for country in countries:
if country=='United Arab Emirates':
continue
img = fp.get_flag_img(country)
img.save(f'{country}_flag.png')df_grp_team = (
euroleague_basketball.groupby(['Country','Team'])
.agg({'Titles_Won': 'sum',
'Years_of_Titles_Won': lambda x: ', '.join(x.dropna()),
})
.sort_values(by='Titles_Won', ascending=False)
.reset_index()
)
df_grp_team = df_grp_team[df_grp_team['Titles_Won'] > 0]
df_grp_team| Country | Team | Titles_Won | Years_of_Titles_Won | |
|---|---|---|---|---|
| 0 | Greece | Panathinaikos | 7 | 1996, 2000, 2002, 2007, 2009, 2011, 2024 |
| 1 | Spain | Real Madrid | 6 | 1995, 2015, 2018, 2023 |
| 2 | Greece | Olympiacos | 3 | 1997, 2012, 2013 |
| 3 | Turkey | Fenerbahce | 2 | 2017, 2025 |
| 4 | Turkey | Anadolu Efes | 2 | 2021, 2022 |
| 5 | Serbia | Partizan | 1 | 1992 |
| 6 | Lithuania | Zalgiris | 1 | 1999 |
Plotting
plt.rcParams['font.family'] = 'Segoe UI Emoji' items = df_grp_team['Years_of_Titles_Won'].to_list()
def comma_newline(s):
parts = [p.strip() for p in s.split(',')]
separators = [',' if i % 2 == 0 else '\n' for i in range(len(parts) - 1)]
return ''.join(p + sep for p, sep in zip(parts, separators)) + parts[-1]
#print(items)
year_won = [comma_newline(s) for s in items]
#print(year_won)
fig, ax = plt.subplots(figsize=(14, 3))#, subplot_kw=dict(polar=True))
plt.scatter(df_grp_team['Team'],[1]*len(df_grp_team['Titles_Won']), s=df_grp_team['Titles_Won']*1500, \
color='orange', alpha=0)
for ind, (x, y, z) in enumerate(zip(df_grp_team['Team'],[1]*len(df_grp_team['Titles_Won']), year_won)):
plt.text(x,y,z, fontsize=9, ha='center', va='top', color='black', family='monospace')
plt.text(x, y,'\U0001F3C0', fontsize=(df_grp_team['Titles_Won'][ind]*10)+30, ha='center', va='center',\
color='orange',zorder=1, alpha=0.8)
plt.text(x, y-0.18,x, fontsize=12, ha='center', va='center', color='#333333')
img = mpimg.imread(f'{df_grp_team["Country"][ind]}_flag.png')
imagebox = OffsetImage(img, zoom=0.3)
# ab = AnnotationBbox(imagebox, (x, y-0.26), frameon=True, bboxprops=dict(edgecolor='lightgray'), zorder=2) # Higher zorder
ab = AnnotationBbox(imagebox, (x, y-0.26), frameon=False, zorder=2) # Higher zorder
ax.add_artist(ab)
plt.axis('off')
plt.xlim(-0.75,6.5)
plt.ylim(0.70,1.2)
plt.title("EuroLeague Basketball Champions", fontsize=20, family='Serif', color='#333333')
fig.patch.set_facecolor('#FFFDD0')
plt.savefig("euro_bb.png", dpi=300, bbox_inches="tight")
plt.show()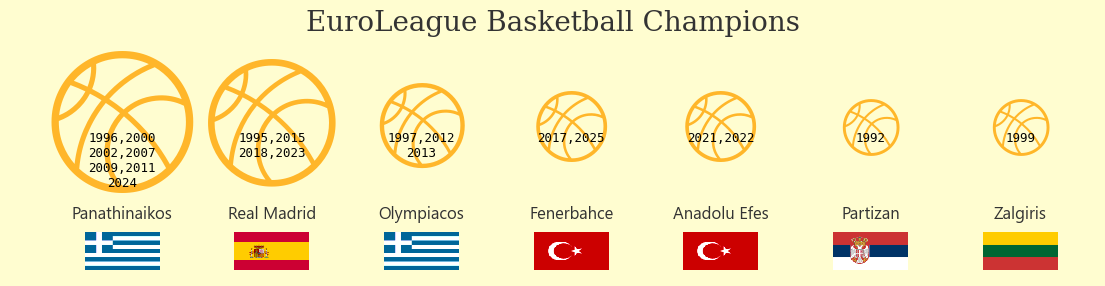
In the data, Real Madrid has six wins but only four years are given.