import pandas as pd
import matplotlib.pyplot as plt
import seaborn as snsTidyTuesday dataset of 2025-08-19
scottish_munros = pd.read_csv('https://raw.githubusercontent.com/rfordatascience/tidytuesday/main/data/2025/2025-08-19/scottish_munros.csv', encoding='latin1')scottish_munros| DoBIH_number | Name | Height_m | Height_ft | xcoord | ycoord | 1891 | 1921 | 1933 | 1953 | 1969 | 1974 | 1981 | 1984 | 1990 | 1997 | 2021 | Comments | |
|---|---|---|---|---|---|---|---|---|---|---|---|---|---|---|---|---|---|---|
| 0 | 1 | Ben Chonzie | 931.0 | 3054.0 | 277324.0 | 730857.0 | Munro | Munro | Munro | Munro | Munro | Munro | Munro | Munro | Munro | Munro | Munro | NaN |
| 1 | 17 | Ben Vorlich | 985.3 | 3233.0 | 262912.0 | 718916.0 | Munro | Munro | Munro | Munro | Munro | Munro | Munro | Munro | Munro | Munro | Munro | NaN |
| 2 | 18 | Stuc a' Chroin | 973.0 | 3192.0 | 261746.0 | 717465.0 | Munro | Munro | Munro | Munro | Munro | Munro | Munro | Munro | Munro | Munro | Munro | NaN |
| 3 | 32 | Ben Lomond | 973.7 | 3195.0 | 236707.0 | 702863.0 | Munro | Munro | Munro | Munro | Munro | Munro | Munro | Munro | Munro | Munro | Munro | NaN |
| 4 | 26 | Ben More | 1174.0 | 3852.0 | 243276.0 | 724417.0 | Munro | Munro | Munro | Munro | Munro | Munro | Munro | Munro | Munro | Munro | Munro | NaN |
| ... | ... | ... | ... | ... | ... | ... | ... | ... | ... | ... | ... | ... | ... | ... | ... | ... | ... | ... |
| 599 | 1258 | Sgurr nan Eag | 926.3 | 3039.0 | 145705.0 | 819536.0 | Munro | Munro | Munro | Munro | Munro | Munro | Munro | Munro | Munro | Munro | Munro | NaN |
| 600 | 1255 | Blabheinn [Bla Bheinn] | 929.0 | 3048.0 | 152990.0 | 821743.0 | Munro | Munro | Munro | Munro | Munro | Munro | Munro | Munro | Munro | Munro | Munro | 1891: Blath Bheinn (Blaven), N Top; 1921-1969:... |
| 601 | 1257 | Blabheinn South Top | 926.5 | 3040.0 | 152855.0 | 821529.0 | Munro Top | NaN | NaN | NaN | NaN | NaN | Munro Top | Munro Top | Munro Top | Munro Top | Munro Top | 1891: Blath Bheinn (Blaven), S Top; 1981-1990:... |
| 602 | 1301 | Ben More | 966.0 | 3169.0 | 152576.0 | 733078.0 | Munro | Munro | Munro | Munro | Munro | Munro | Munro | Munro | Munro | Munro | Munro | NaN |
| 603 | Ten-figure grid references suitable for Garmin... | NaN | NaN | NaN | NaN | NaN | NaN | NaN | NaN | NaN | NaN | NaN | NaN | NaN | NaN | NaN | NaN | NaN |
604 rows × 18 columns
scottish_munros.columnsIndex(['DoBIH_number', 'Name', 'Height_m', 'Height_ft', 'xcoord', 'ycoord',
'1891', '1921', '1933', '1953', '1969', '1974', '1981', '1984', '1990',
'1997', '2021', 'Comments'],
dtype='object')scottish_munros.groupby('1891').count()| DoBIH_number | Name | Height_m | Height_ft | xcoord | ycoord | 1921 | 1933 | 1953 | 1969 | 1974 | 1981 | 1984 | 1990 | 1997 | 2021 | Comments | |
|---|---|---|---|---|---|---|---|---|---|---|---|---|---|---|---|---|---|
| 1891 | |||||||||||||||||
| Munro | 283 | 283 | 283 | 283 | 283 | 283 | 279 | 279 | 278 | 278 | 277 | 279 | 280 | 280 | 277 | 277 | 106 |
| Munro Top | 255 | 255 | 255 | 255 | 255 | 255 | 242 | 242 | 242 | 242 | 233 | 196 | 194 | 194 | 191 | 190 | 142 |
sns.histplot(scottish_munros, x='Height_ft', hue='1891', multiple='stack', bins=20)
plt.show()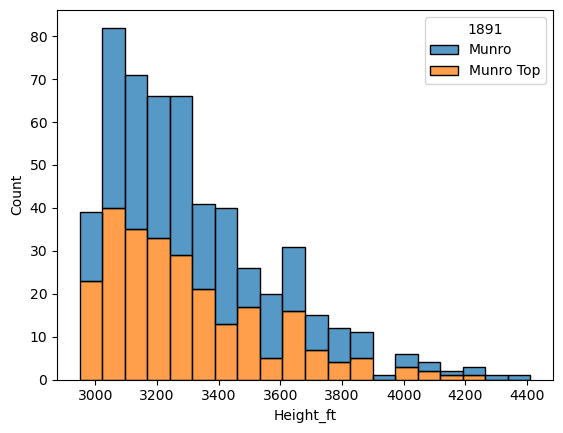
scottish_munros_long = scottish_munros.melt(id_vars=['DoBIH_number', 'Name', 'Height_m', 'Height_ft', 'xcoord', 'ycoord', 'Comments'], var_name='year', value_name='munro_type')
munro_counts = scottish_munros_long.groupby(['year', 'munro_type']).size()sns.set_style("dark", {
'axes.facecolor': 'darkgrey', # background of the plot
'figure.facecolor': 'darkgrey', # background around the plot
'axes.edgecolor': 'gainsboro',
'font.family': 'monospace',
})
sns.set_context("notebook", font_scale=2)
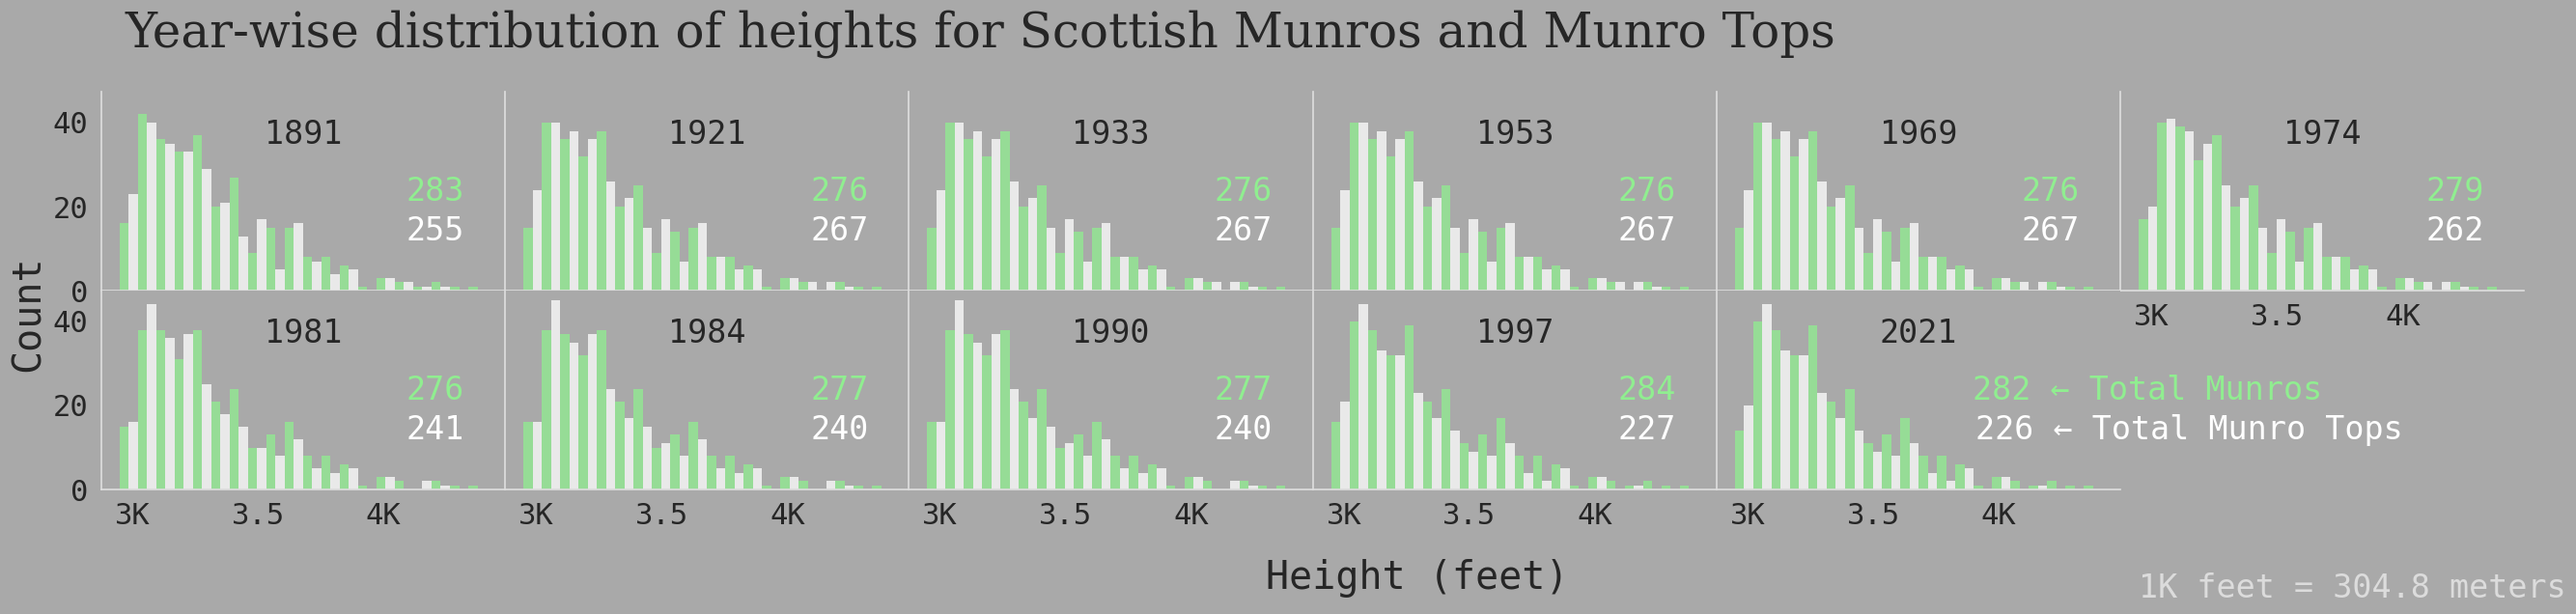
g = sns.displot(data=scottish_munros_long, x='Height_ft', hue='munro_type', col='year', \
col_wrap=6, kind='hist', multiple='dodge', palette=['lightgreen','white'], \
height=3, aspect=1.5, bins=20, edgecolor='none')
#sns.move_legend(g,"lower right", bbox_to_anchor=(0.875, 0.2), title=None, frameon=False)
g.legend.set_visible(False)
g.set_axis_labels("", "")
g.figure.suptitle("Year-wise distribution of heights for Scottish Munros and Munro Tops",\
x=0.05, y=1.025, ha='left', fontfamily='serif', fontsize=36)
g.figure.subplots_adjust(wspace=0, hspace=0)
text_obj = g.figure.supylabel('Count')
x, y = text_obj.get_position() # get current position
text_obj.set_position((x - 0.01, y))
g.figure.supxlabel('Height (feet)')
custom_ticks = [3000, 3500, 4000]
custom_labels = ['3K', '3.5', '4K']
# Set the ticks and labels on each axis in the grid
for ax in g.axes.flat:
ax.set_xticks(custom_ticks)
ax.set_xticklabels(custom_labels)
title_text = ax.get_title()
year = title_text.split('=')[-1].strip()
year_counts = munro_counts.loc[year]
for i, (mt, m_count) in enumerate(year_counts.items()):
k=0
if(i==0):
if(ax == g.axes.flat[-1]):
m_count = f'{m_count} ← Total Munros'
k = 0.6
ax.text(0.9 + k, 0.5 - i * 0.1, f'{m_count}', transform=ax.transAxes, ha='right', va='center', color='lightgreen')
else:
if(ax == g.axes.flat[-1]):
m_count = f'{m_count} ← Total Munro Tops'
k = 0.8
ax.text(0.9 + k, 0.5 - i * 0.2, f'{m_count}', transform=ax.transAxes, ha='right', va='center', color='white')
g.set_titles("{col_name}", y=0.7)
g.figure.text(0.90, 0.01, '1K feet = 304.8 meters', ha='right', color='gainsboro')
sns.despine()
#g.figure.savefig('Scottish_munros.png', dpi=300, bbox_inches='tight',pad_inches=0.25)
plt.show()