library(tidyverse)
library(uk2us)
user2025 <- readr::read_csv('https://raw.githubusercontent.com/rfordatascience/tidytuesday/main/data/2025/2025-04-29/user2025.csv')
user2025# A tibble: 128 × 11
id session date time room title content video_recording keywords
<dbl> <chr> <date> <chr> <chr> <chr> <chr> <chr> <chr>
1 170 Virtual 2025-08-01 TBD Online A Rob… In R p… ✅ statist…
2 79 Virtual 2025-08-01 TBD Online A fir… Positr… ✅ ide, wo…
3 30 Virtual 2025-08-01 TBD Online Analy… This t… ✅ demogra…
4 31 Virtual 2025-08-01 TBD Online Autom… Webhoo… ✅ automat…
5 39 Virtual 2025-08-01 TBD Online Beyon… In a w… ✅ marketi…
6 169 Virtual 2025-08-01 TBD Online CSV t… CSV is… ✅ data pr…
7 94 Virtual 2025-08-01 TBD Online Data … Explor… ✅ factor …
8 163 Virtual 2025-08-01 TBD Online Don’t… The fa… ✅ testing…
9 13 Virtual 2025-08-01 TBD Online Exper… Large … ✅ automat…
10 51 Virtual 2025-08-01 TBD Online From … Data S… ✅ quarto,…
# ℹ 118 more rows
# ℹ 2 more variables: speakers <chr>, co_authors <chr>normalize_keywords_uk2us <- function(phrases) {
phrases %>%
str_split("\\s+") %>%
map(~ uk2us::convert_uk2us(.x)) %>%
map_chr(str_c, collapse = " ")
}Plotting
user2025 %>%
separate_rows(keywords, sep = ",") %>%
mutate(keywords = str_trim(keywords)) %>%
mutate(keywords = normalize_keywords_uk2us(keywords)) %>%
group_by(keywords) %>%
summarise(count = n()) %>%
arrange(desc(count)) %>%
slice(1:20) %>%
ggplot(aes(x = reorder(keywords, count), y = count, fill=count)) +
geom_bar(stat = "identity") +
geom_text(aes(label = reorder(keywords, count), y=count/2), hjust = 0,
size = 3.5, color=rep(c("white", "#555"), times=c(8,12))) +
coord_flip() +
scale_fill_viridis_c(option="magma", direction = -1)+
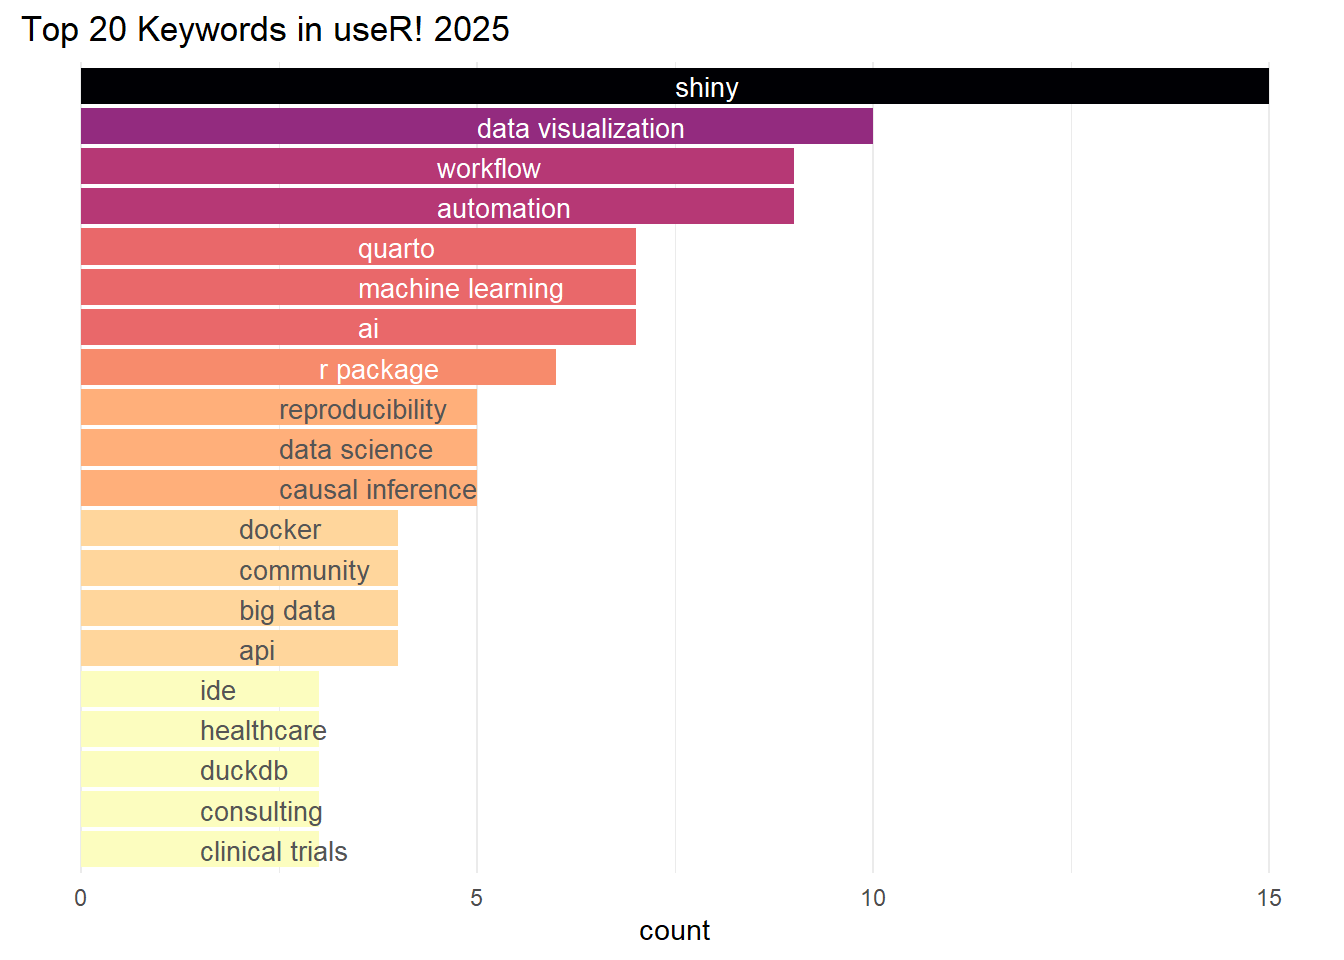
labs(title = "Top 20 Keywords in useR! 2025") +
theme_minimal() +
theme(
axis.text.y = element_blank(),
axis.ticks.y = element_blank(),
axis.title.y = element_blank(),
legend.position = "none",
panel.grid.major.y = element_blank()
)
ggsave("user2025_keywords.png", width = 8, height = 6, dpi = 300)